Translating the Dashboard
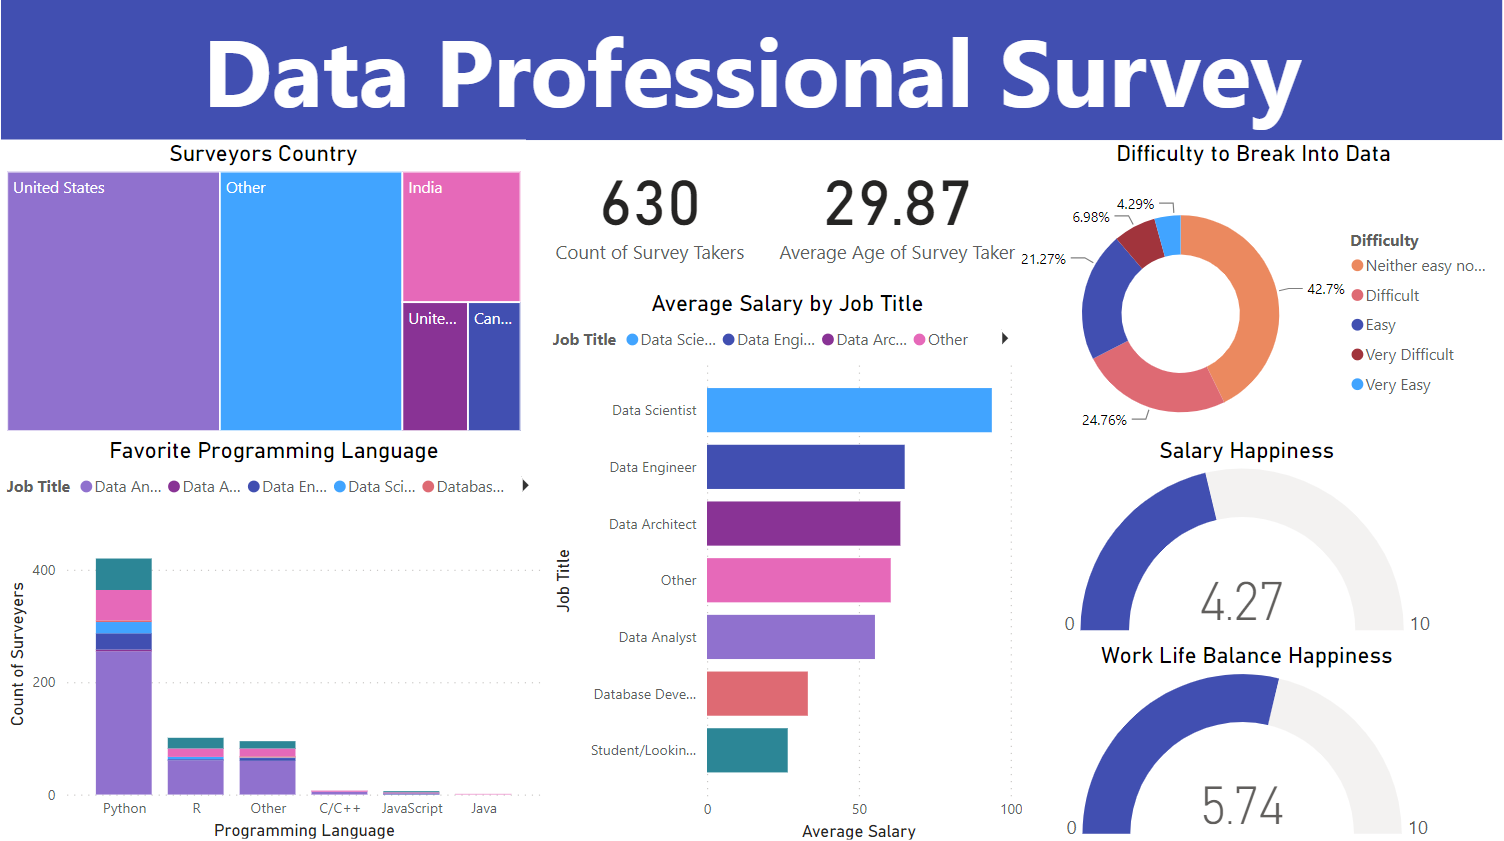
This dashboard displays information derived from a survey conducted among data professionals. It illustrates the respondents' locations, age distribution, preferred programming languages, average salary relative to their job titles, difficulty ratings regarding breaking into the data industry, and their satisfaction levels with both salary and work-life balance.
How this dashboard can be used
Say you were considering breaking into the data industry. How exciting! However, before you do so, you want to gain insights from those who have successfully transitioned into the world of data and those who, like you, are aspiring to do so. To serve as a valuable resource for these inquiries, I've developed a comprehensive dashboard using Power BI. A pie chart is utilized to illustrate the potential of encountering a challenge as you enter the industry. A gauge provides a visual representation of your expected satisfaction levels regarding salary and work-life balance. Additionally, a bar chart offers insights into job titles you aspire to obtain based on your desired income. To further guide you, the dashboard utilizes a stacked-column chart to present information on the preferred programming languages among data professionals, aiding you in selecting the right tools for your own journey into the world of data.
This dashboard is just one example of how Power BI is a powerful tool that enables organizations to analyze, visualize, and share insights from data.

I have included a screenshot of the dashboard, in case there are issues with the dashboard above.